2.14. MedeA Phonon: Capture Relevant Temperatures, Predict Infrared and Raman Spectra
Contents
| download: | pdf |
|---|
Introduction and Capabilities
Phonon 2.0 is a computational tool for the calculation of lattice dynamics and vibrational properties, including vibrational spectroscopy predicting Infrared and Raman spectra. Choosing suitable model structures with periodic boundary conditions, solids but also surfaces, interfaces and molecules can be studied. MedeA Phonon in conjunction with MedeA VASP provides access to vibrational properties of systems containing any element of the periodic table in a fully automated fashion.
The fundamental capabilities of Phonon 2.0 are:
- Calculation of phonon dispersion curves along any path through the Brillouin zone
- Animation of phonon modes, i.e. visualization of the collective movements of all atoms in the structural model for any phonon branch throughout the Brillouin zone.
- Calculation of the phonon density of states and its partial contributions of all atoms in each Cartesian direction
- Temperature dependent thermodynamic functions, such as internal energy, entropy, free energy, and heat capacity
- Symmetry analysis, deriving Infrared and Raman activity of all modes at the Gamma point
- Relative intensity of Infrared and Raman active modes, which allows prediction of Infrared and Raman spectra
Phonon is based on the so-called direct method (see Parlinski, Li & Kawazoe [1]) requiring an underlying method to compute forces on atoms. Together with the ab-initio code VASP as a source for accurate forces, MedeA Phonon provides fully automated procedures. Phonon also works with other methods for deriving forces (ab-initio or forcefields), however, with reduced levels of automation.
The direct approach to lattice dynamics requires the following procedure, which is at the heart of any calculation by the Phonon module; more details are found in section III.H. Vibrations in Solids - Phonons:
- Create a sufficiently large supercell to minimize interactions between equivalent atoms in adjacent supercells and optimize (if required) atom positions of the supercell to ensure that forces on all atoms are vanishingly small. The structure should be at equilibrium.
- Generate, based on the cell symmetry, a set of supercells wherein each cell one atom is displaced from the optimized supercell and forces are calculated on all other atoms.
- Derive force constants from forces and build the dynamical matrix, diagonalize and determine phonon frequencies (eigenvalues) for points in reciprocal space (k vectors), obtain from the corresponding eigenvectors (polarization vectors), intensities (form factors) and movements of atoms (animation of modes).
- Integrate over a sample of k vectors to yield the phonon density of states and calculate thermodynamic functions In addition to the main phonon procedure outlined above, the thermodynamics can be enhanced by additional VASP calculations:
- The leading term of the thermodynamic functions is the electronic energy (or electronic formation energy), which can be obtained by an accurate VASP single point energy calculation for the system (selecting the Energy of formation property from the MedeA VASP Calculation Tab).
- For metals, an extra temperature dependent contribution can be added to the thermodynamic functions, which takes into account increasing occupation of excited states with increasing temperature utilizing integration over the electronic density of states close to the Fermi level. In order to obtain the split of longitudinal and transversal modes at the Gamma point (LO/TO splitting) for polar crystals, as well as Infrared spectra and Raman spectra for insulating and semiconducting systems, additional VASP calculations for the response of the electron system to the electric field are required.
- Specifically, for the LO/TO splitting and infrared intensities the dielectric tensor and the Born effective charges need to be calculated for the system by means of VASP linear response calculations.
- For the Raman intensities, in addition to the above, the Raman tensor needs to be evaluated from a finite differences approach, which requires VASP linear response calculations of the dielectric tensor for a complete set of structures with displaced atoms within a suitable small supercell.
All of these computational steps are performed in a fully automatic fashion by the Phonon module without any intervention by the user.
2.14.1. Starting the Phonon interface
From the MedeA toolbar, select Tools >> Phonon to open a new menu entry Phonon which will remain in the toolbar during the MedeA session.
Clicking Phonon in the MedeA toolbar provides the following choices:

With a structure model window active, select Run to set up the computational parameters and run a new Phonon calculation, or to recalculate phonons or rerun some of the VASP calculations for a previously finished Phonon job of this system. For a new Phonon calculation it is recommended to start with an optimized structural model, in particular, if atomic degrees of freedom are allowed by the crystal symmetry. The residual forces in the initial model have a huge impact on the quality of the results.
Phonon Dispersion: Opens a list of all available phonon dispersion curves from previous Phonon calculations. Selected phonon dispersion curves are displayed, information on form factors (intensities) and exact points are reported and for each point the phonon mode can be animated.
Phonon Density of States: Opens a list of available phonon density of states from previous Phonon calculations. Selected phonon densities of states and their partial contributions of atoms in each Cartesian direction are displayed.
Thermodynamic Functions: Opens a list of available thermodynamic functions from previous Phonon or MT (i.e. elastic constants) calculations. Selected temperature dependent functions such as internal energy, entropy, and free energy, and their various electronic and vibrational contributions can be displayed and customized (see section 2.11.3 on MedeA Analysis of Thermodynamic Functions).
Export Dispersion and DOS: Opens a list of all available phonon dispersion curves and phonon density of states from previous Phonon calculations. Selected dispersion and DOS data are exported into an Excel spreadsheet, also allowing combined plots of dispersion and DOS.
Alternatively to access from the Phonon menu, the above analysis tools can also be invoked from the Analysis menu item of MedeA.

For each variable, context-sensitive help and reset capabilities are provided by right-clicking in any input field or checkbox. Balloon help explains the options and offers a reset to the respective default value.
Context-sensitive help and reset: A click of the right mouse button with the cursor on any of the white entry fields, selection canvas or check-boxes will bring up a help text explaining the options for this particular parameter. This capability also allows resetting the parameter to its default value.
2.14.2. Description of the Run Phonon Interface
The Phonon graphical user interface consists of a stack of panels, which are described in detail below.

2.14.2.1. Calculation Panel
The Calculation panel controls all major settings of the Phonon calculation and is split into two parts:
The left-hand section allows specifying the type of calculation, the main computational parameters for the phonon supercell calculations, and allows selection of the properties requiring additional VASP calculations, such as accurate electronic energies (electronic energy of formation), electronic contributions to thermodynamics, LO/TO splitting, Infrared and Raman spectra.
The right-hand section controls which part of the Phonon procedures should be executed, i.e. which Action to execute. Furthermore, it provides access to VASP Settings for the phonon supercell calculations, as well as for the various properties selected in the left hand section.
The Calculation panel with default settings for a system with a centered lattice type is shown below.

Selecting the Action
There are four choices for the required action, which is initiated and executed by the Run button:
Action: Complete Phonon calculation


Run all: all steps of a Phonon calculation are executed in a fully automated fashion: Symmetry analysis, creation of the supercell, optimization of all atom positions by VASP, creation of a set of supercells with displaced atoms, single point energy calculations on all supercells with VASP, evaluating force constants and the dynamical matrix, calculation of dispersion curves, phonon density of states and thermodynamic functions, Raman and Infrared activities and thermodynamic functions. Besides, whatever property is selected on the left-hand section, all required additional calculations for accurate total energy, and electronic contributions to the thermodynamics, LO/TO splitting, Infrared and Raman spectra are performed automatically.
In a computing environment with more than one machine as TaskServer, all of the VASP calculations on supercells can be carried out in a parallel fashion. The geometry optimization of the undisplaced supercell is performed first, this geometry serves as a reference for the displacements. Then, depending on the setup of the JobServer, all of the different supercells with displaced atoms are farmed out to be computed in an efficient way with VASP, using the results from the undisplaced cell.
Relax atom positions of supercell without displaced atoms: Atom positions of the unperturbed supercell are optimized by VASP, a new minimized cell is created that may differ from the initial structure, and the supercells with displaced atoms are created from this minimized cell. This procedure is recommended whenever atoms of the structure have free parameters according to symmetry. This ensures that the forces are close to zero for the supercell without displaced atoms.
Start from wave functions of other supercells: accelerates VASP calculations by using better initial wave functions. Such wave functions are stored in large files which must be transferred between the TaskServers and the JobServer, considerably increasing the file transfer burden for the job. Hence the benefit of using of this option depends on network performance and the size of the wave function file.
VASP Settings open the MedeA VASP interface allowing customizing all computational parameters for a given task of the overall procedure. Depending on the selection of properties in the left-hand section, one up to four different VASP Settings buttons may appear, each providing different default values suitable for the task.

VASP Settings for the following tasks may be available:
1. For the Phonon supercell calculations, allowing customization of all computational parameters except the settings for cell shape and cell volume optimization, which are ignored as they conflict with the purpose of a Phonon calculation. In Run all mode these settings can be always customized independent of the property selection, and suitable default values are chosen. For semiconducting or insulating systems it is recommended to switch to Gaussian smearing for the integration technique in the SCF Tab of the VASP interface.
2. For customizing parameters of the VASP calculations for the initial system to yield Electronic energy and DOS contributions. Defaults are set to Standard 500 settings to obtain accurate total energy or formation energy, if Accurate electronic energy for thermodynamics is selected to the left of the Calculation Tab. To include the electronic formation energy to the thermodynamic functions, the Energy of formation property needs to be selected from the Calculation Tab of the MedeA VASP interface. If besides Temperature dependent electronic contributions (DOS) to thermodynamic functions (for metals) is selected, the electronic density of states on a fine energy mesh focused on the vicinity of the Fermi level is calculated in a second task with the same computational VASP parameters.
3. For customizing parameters of the VASP linear response calculations for the initial system to obtain Infrared spectra and LO/TO mode split, if Infrared spectra and LO/TO mode split (for insulators and semiconductors) is selected to the left of the Calculation Tab. Suitable defaults are chosen for such a task, and differently from the Response tensors Properties of the VASP interface, the response to atomic degrees of freedom are omitted and only the response to variations of the electric field are included.
4. For customizing parameters of the VASP linear response calculations for a set of small supercells with displaced atoms as specified in the IR/Raman/LO-TO Tab of the Phonon interface for the Raman spectra calculations, in case Raman spectra (insulators and semiconductors) is selected to the left of the Calculation Tab.
Note
Run all requires a valid license of the chosen VASP module.
Action: Input files for Phonon calculation
Write input files for supercell calculations: creates all input files for supercell calculations in a job directory when confirmed with Run.

This is useful for applying an external code different from VASP to calculate geometry optimization and forces. The Phonon calculation may be resumed later with the Recalculate option discussed below. This action might be useful for those interested in analyzing in more detail all of the input structures, or those interested in the symmetry analysis only.
Action: Recalculate Phonon dispersion and DOS
Recalculate dispersion and density of state, as well as all other properties from a previously finished Phonon calculation with modified computational parameters, without running VASP again.

The options defining the supercells are provided in the Calculation and Supercell panel. The selections for the properties cannot be changed without running VASP calculations again; therefore they are inactive and grayed out. All options in Advanced, Phonon Dispersion and Phonon DOS tabs can be modified.
Action: Rerun VASP based properties
Rerun VASP based properties as selected or Rerun VASP based properties +Raman as selected from a previously finished Phonon calculation with a modified selection of properties and/or modified VASP parameters for these properties.

Depending on the selection of properties to the left, the corresponding VASP Settings buttons for customization of VASP parameters appear. All options in Advanced, Phonon Dispersion and Phonon DOS Tabs can be modified as above, however, the options defining the supercells provided in the Calculation and Supercell panels cannot be changed and are grayed out. This Action can be used for the same purpose as the Recalculate option, and in addition to add or remove property calculations and to modify the VASP calculations involved for these properties. Therefore, it is possible to add the LO/TO splitting, the improvements to thermodynamics or the spectroscopic properties to a previously finished Phonon calculation (this is also possible for old Phonon 1.0 calculations, where these options were not available), or to remove these features from the previous Phonon calculation. Likewise it is possible to include a posteriori the formation energy as the leading term for the thermodynamic functions by means of this Action and by selecting Energy of formation in the Properties frame of the VASP GUI as launched for Electronic energy and DOS contributions. Whereas Rerun VASP based properties as selected will handle Raman spectra according to the previous job settings (either simple recalculation without running VASP again, or not including Raman spectra, if they haven’t been selected before), the option Rerun VASP based properties +Raman as selected will add, modify or remove the Raman spectra, and all VASP calculations required for the Raman tensor.

For a recalculation and for rerunning VASP based properties, the Run Phonon interface must be invoked for the minimized structure of the previous Phonon job (minimized.sci) or - if not available - the initial structure (initial.sci). The previously finished Phonon job can then be selected by clicking on … selecting the appropriate directory. The job number is then displayed in the entry field using files from. The status of all panels in Phonon is updated with the options as selected in the previous Phonon calculation, and for Rerun also the VASP parameters for all property calculations are updated, if VASP versions are chosen identical for current and previous Phonon calculations. Modify the required options, and recalculate or rerun Phonon on the JobServer with Run.
2.14.2.2. Selecting the Type of Calculation
Type of calculation offers three choices as affecting the shape of the supercell and determines which parts of the Brillouin zone or which directions in k space are sampled with high accuracy.

Full Brillouin zone: explore the whole Brillouin zone with a supercell extending equally in all directions.
The Direction in Brillouin zone: explore a selected direction in the reciprocal space in detail with a supercell extending mainly into one direction and being as short as possible in the other directions. This offers higher accuracy of phonon frequency along this direction, at the expense of rather large errors in most of the other parts of the Brillouin zone.
Custom supercell: can be specified in the Supercell panel.
Note
The size and symmetry of the selected supercell have a tremendous effect on computational demands. It is therefore recommended that you inspect these important issues in the Supercell panel. Selecting the Supercell Tab automatically creates the supercell and analyses its symmetry and provides the resulting information as well as the number of supercell calculations required. The supercell can also be viewed from this panel.
Full Brillouin zone: creates a supercell extending about equally in all directions of space. The size of the supercell and the magnitude of displacements of atoms are defined in the two entry fields:
Interaction range - defines the approximate size of the supercell in \({\mathring{\mathrm{A}}}\). A value of 10 \({\mathring{\mathrm{A}}}\) provides a supercell with about 10 \({\mathring{\mathrm{A}}}\) length of all three lattice parameters.

Note
The size of the supercell cannot be changed continuously by definition. Consequently, a small change in the Interaction range parameter may cause an increase or decreases in the number of atoms in the cell by up to a factor of eight, which imposes a huge impact on computational demands.
Displacement of atoms defines the displacements of atoms from their equilibrium positions to evaluate resulting force constants. If chosen too small, the forces might be too small and within the computational noise. If chosen too large, one may leave the harmonic regime. The atoms may be displaced into the positive direction only (+) or positive and negative directions (+/-). The latter option is strongly recommended and may avoid serious errors in particular for structures of lower symmetry, but doubles computational demands.
Below these entry fields Available properties are shown: Since the whole Brillouin zone is sampled, dispersion curves throughout the whole Brillouin zone, phonon density of states and all derived properties such as thermodynamic functions can be obtained by this type of calculation.
Besides, further properties can be selected, which require additional VASP calculations:
Accurate electronic energy for thermodynamics: adds an accurate VASP single point calculation for the initial system yielding the total energy. To use the electronic formation energy for the leading term of the thermodynamic functions, the property Energy of formation need to be selected in the Calculation Tab of the MedeA VASP interface, which is brought up by pushing the VASP Settings button for Electronic energy and DOS contributions to the right.
Temperature dependent electronic contributions (DOS) to thermodynamic functions (for metals): adds the temperature dependent electronic contributions to the thermodynamic functions due to increasingly occupying excited states with increasing temperature. This contribution is obtained by integrating the electronic density of states of the initial system in the vicinity of the Fermi level. VASP parameters for this and the above task can be set by pushing the VASP Settings button for Electronic energy and DOS contributions to the right.
Infrared spectra and LO/TO mode split (for insulators and semiconductors): adds a linear response calculation of the dielectric tensor and Born effective charges of the initial system, resulting in LO/TO mode splitting at the Gamma point for polar systems and in infrared intensities and spectra. This is a sensitive option only for insulators and semiconductors. VASP parameters can be set by pushing the VASP Settings button for Infrared spectra and LO/TO mode split on the right-hand part of the panel.
Raman spectra (insulators and semiconductors): This adds linear response calculations for a set of small supercells with displaced atoms as specified in the IR/Raman/LO-TO Tab of the Phonon interface to obtain the Raman tensor from finite differences and consequently the Raman intensities and spectra. The VASP Settings button for Raman spectra calculations allow customization of VASP parameters for this task. It is noted that the computational demands for this task may be considerable, and may even exceed the demands for the supercell phonon calculations.
The Direction in Brillouin zone option creates a supercell that extends only into one specified direction of space and is as small as possible in the other directions. The lattice vibrations in the selected direction can then be explored with high accuracy. The main parameters define the direction and extension of the supercell, the magnitude of displacements of atoms and the option to calculate displacements in both directions.
k-direction x, y and z: specify the direction in k-space that is to be explored in detail.
Interaction range - defines the approximate size of the supercell in the direction specified above (in \({\mathring{\mathrm{A}}}\)). The extension in other directions is chosen automatically.

Below these entry fields, the available properties are shown. This calculation type provides accurate phonon frequencies in only one direction, for which highly accurate dispersion curves can be plotted. All other data based on the phonon density of states are not accessible here.
LO/TO mode split (for insulators and semiconductors) - adds the identical linear response calculation of the dielectric tensor and Born effective charges of the initial system as described above for Infrared spectra and LO/TO mode split (for insulators and semiconductors) to obtain the LO/TO splitting at the Gamma point for polar systems.
Custom supercell: offers full access to the shape of the supercell in the Supercell panel.

Available properties are shown below. Whether these properties can be calculated reasonably from the selected supercell has to be decided individually. A total of six properties can be checked:
- Phonon dispersion curves and form factor
- Phonon density of states and thermodynamic functions, as well as
- Accurate electronic energy for thermodynamics,
- Temperature dependent electronic contributions (DOS) to thermodynamic functions (for metals),
- Infrared spectra and LO/TO mode split (for insulators and semiconductors), and
- Raman spectra (insulators and semiconductors), as described above for the Full Brillouin zone mode.
2.14.2.3. Size and Symmetry of the Supercell
Opening the Supercell panel automatically invokes the internal creation and symmetry analysis of the supercell specified by all settings in Type of calculation. The generating lattice vectors (in terms of the original lattice vectors) are provided in the frame labeled New Lattice Vectors.

Below this frame you find information on the type of supercell and its number of atoms, and whether the supercell breaks the symmetry of the original cell or not. (The symmetry is broken if some symmetry operations for the original cell are not symmetry operations of the supercell, considering lattice vectors as fixed.) Finally, the number of supercells with displaced atoms that are required to calculate the dynamic matrix.
The View supercell button creates the supercell in a separate model window. In order to rotate, zoom, analyze the supercell model, it is necessary to close the Run Phonon window and activate the supercell window.
As an example, supercells of the intermetallic compound NiAl and information provided by the supercell panel are shown below for a default full Brillouin zone calculation and a default calculation for the [001] direction.
| Full Brillouinzone | Direction in Brillouinzone | Custom Supercell | |
 |
 |
 |
|
| \(\begin{pmatrix} a' \\ b' \\ c' \end{pmatrix} =\) | \(\begin{pmatrix} 3 & 0 & 0 \\ 0 & 3 & 0 \\ 0 & 0 & 3 \end{pmatrix} \cdot \begin{pmatrix} a \\ b \\ c \end{pmatrix}\) | \(\begin{pmatrix} \frac{1}{2} & -\frac{1}{2} & 0 \\ \frac{1}{2} & \ \ \frac{1}{2} & 0 \\ 0 & \ \ 0 & 9 \end{pmatrix} \cdot \begin{pmatrix} a \\ b \\ c \end{pmatrix}\) | \(\begin{pmatrix} 0 & 1 & 1 \\ 1 & 0 & 1 \\ 1 & 1 & 0 \end{pmatrix} \cdot \begin{pmatrix} a \\ b \\ c \end{pmatrix}\) |
| Atoms | 5 cells with 216 atoms | 9 cells with 36 atoms | 5 cells with 16 atoms |
Unlike the other types of calculation, where the supercell panel provides only information, with a Custom supercell calculation the supercell is specified in the supercell panel.
New Lattice Vectors a, b and c provides nine entry fields for specifying the three components of each new lattice vector. This defines the supercell in terms of the lattice vectors of the original cell.
Verify invokes creation and symmetry analysis of the specified supercell. If the new lattice vectors do not specify a valid supercell an error message is issued and the lattice vectors need to be changed.
View creates the supercell in a separate model window. To rotate, zoom, analyze the supercell model, it is necessary to close the Run Phonon window and make the supercell the active window.
Note
Before invoking the Run Phonon interface again, activate the window of the original structure model; otherwise you create a supercell of a supercell.
Note
The three types of defining supercells within Phonon are also found in Edit >> Build supercell and the correspondence is the following:
Full Brillouin zone is equal to Automatic with Supercell extends equally in all directions
Direction in Brillouin zone is equal to Automatic with Supercell extends in one direction only.
Custom supercell can also be created with Custom in the Supercell builder
2.14.2.4. Advanced Panel
The Advanced panel has two different parts: The left-hand section allows one to specify or enforce invariance conditions for the force constants, restore symmetry for hexagonal space groups and specify hydrogen isotopes (shown only for systems with hydrogen atoms).

The right-hand section provides access to an approximate treatment of LO/TO mode splitting, which is obsolete and kept only to enable Recalculation of old jobs.
2.14.2.4.1. Selecting Invariance Conditions
The forces should automatically satisfy translational and rotational invariance conditions. Consequently, the acoustic phonon modes should be zero at the Gamma point. Due to numerical inaccuracies, this may not always be the case.

As a remedy it is possible to enforce the invariance conditions by checking the boxes for Translational invariance and/or Rotational invariance and by selecting a non-zero value for the Strength of condition parameter. This enforces the invariance conditions affecting all force constant parameters. Choosing the strength parameter too large may result in errors of the force constants. Simple crystals may require higher values than systems containing many atoms.
Alternatively, one may again check the invariance boxes but set the Strength of condition to zero. In this case, the invariance conditions are used to set the on-site force constants. That might be successful for crystals of lower complexity and higher symmetry. However, it may fail if the number of constraints and the number of on-site force constants are different. The above method affecting all force constants as specified by the strength parameter works in all cases.
It is encouraged to enforce Translational invariance only. For very large systems, however, this increases dramatically the memory demands and may even cause the failure of Phonon to provide dispersion and phonon DOS.
2.14.2.4.2. Restore Symmetry of Hexagonal Space Group
For hexagonal space groups, the supercells typically break the symmetry of the lattice, causing broken degeneracies in the phonon dispersion curves and possibly failure of the approaches to LO/TO mode split and Infrared spectra. This option invokes a procedure to restore the hexagonal symmetry and thereby fixes the above-mentioned issues.
2.14.2.4.3. Isotope Effects in General and Hydrogen Isotopes
In general, isotope effects on the vibrational properties can be modeled by specifying the atomic mass for the atoms of interest from the Edit Structure menu or the molecular spreadsheets. If a mass is specified for an atom in the model, then the vibrational properties are evaluated corresponding to this mass. If masses are not set, the average mass of the natural mix of isotopes is assumed (default behavior). If masses are set for some atoms in the model, a warning is issued upon opening the Phonon interface. Isotope effects can be applied also for a previous Phonon job using the Recalculate or Rerun actions.

If the system contains hydrogen atoms, there is special access to isotope effects from the Advanced panel: In such cases, an extra Advanced subpanel appears with a choice for the Hydrogen isotopes. The options are Defined by model (defined by the masses as set for the model), Natural mix, Hydrogen (mass = 1 amu), Deuterium, (mass = 2 amu) and Tritium (mass = 3 amu). The selected mass is set for all hydrogen atoms present in the model.
2.14.2.4.4. Restrict Evaluation of Force Constants to a Subset of Atoms
It is possible to restrict the calculation of phonon modes to a subset of atoms, such as layers of a surface, molecules adsorbed on a surface, or considering atoms moving in a rigid lattice. The main objective is to avoid the investment of computational resources for the host material if vibrational modes are of interest only for a small subset. To this end, atoms need to be defined as frozen using the Edit Structure menu or the molecular spreadsheet. Launching the Phonon interface for such a model issues a Warning about atoms being frozen, and the subsequent Phonon calculation restricts the evaluation of force constants to those atoms not frozen. These restrictions are exclusively triggered by the frozen mode of atoms, there is no specific option to be set in the Phonon interface.
2.14.2.4.5. Approximating LO/TO Mode Splitting (for Recalculation of Old Phonon 1.0 Jobs Only)
In polar crystals, the macroscopic electric field leads to a non-analytical term of the dynamical matrix at the Gamma point. As a consequence, without any further approximation, the LO/TO mode splitting at the Gamma point cannot be treated and only the TO mode is obtained. However, this non-analytic contribution may be taken into account in an approximate form making use of the Born effective charge tensor.
More details are in section III.H. 1. 5. Invariance.
In Phonon 2.0 this is integrated into the automatic procedures and the below description in this section should be ignored. The interface described below is intended, and only becomes accessible for Recalculations of old Phonon jobs with the main goal of reproducing older results.
The approximation to LO/TO mode splitting is invoked by chosing Approximate LO/TO splitting in the pulldown menu for Polar crystals, which provides access to the following input parameters:
Dielectric constant -allows you to specify the electronic dielectric constant of the crystal
Power of interpolation function - This allows modeling the longitudinal phonon dispersion curve between the Gamma point and the Brillouin zone surface. If chosen larger than 1.0, the longitudinal dispersion curve will tend to be closer to the value at Gamma for most wave vectors, except at the vicinity of the zone surface. If chosen between 0.0 and 1.0, the dispersion curve will reach the longitudinal phonon mode only quite close to the Brillouin zone center.
Ensure electric charge neutrality - This actively ensures electric charge conservation law. Charge neutrality may also be ensured when setting the Born effective charge tensor.
Born effective charge tensor - This is a frame for the input of the independent parameters of the Born effective charge tensor for each non-equivalent atom. The number of independent parameters depends on the site symmetry.
2.14.2.5. Phonon Dispersion Panel
MedeA has standard paths for plotting the phonon dispersion curves for all lattice types. The total number of points can be specified in the entry field Maximum number of points.

Besides, MedeA offers the possibility to select
certain segments in the Brillouin zone, which can be accessed by
checking the box  Manually define the path.
The path is defined in k-space by a list of the vertices, and the vertices of
the default path are displayed if the checkbox is selected. The labels are
adapted to the symmetry of the active structure.
Manually define the path.
The path is defined in k-space by a list of the vertices, and the vertices of
the default path are displayed if the checkbox is selected. The labels are
adapted to the symmetry of the active structure.

Points can be added and deleted by clicking on the menu buttons of the vertices or the menu item Add a new point. To get back to the default path use Reset to default path.

New points and labels are defined by Define a new point.
In the automatic mode, the number of k-points is still defined by the parameter Maximum number of points. The number of points is not critical for CPU time demands as is the case for ab-initio techniques.
2.14.2.6. Phonon DOS Panel
The phonon density of states (Phonon DOS) requires a fairly dense k-space sampling. The mesh density can be specified by the Quality of k-point sampling and the predefined settings are Coarse, Medium, Fine, and Extrafine.
Also, Custom opens up an entry field for the Number of sampling k-points. The phonon DOS is evaluated with the histogram technique and the width of the frequency mesh is chosen by Frequency interval in THz.
2.14.2.7. Phonon IR/Raman/LO-TO Panel

This panel provides parameters for the LO/TO mode splitting around the Gamma point, relevant also for the Infrared spectra, and for calculating the Raman tensor. There are two options for the LO/TO mode splitting:
Power of interpolation function - This allows modeling the longitudinal phonon dispersion curve between the Gamma point and the Brillouin zone surface. If chosen larger than 1.0, the longitudinal dispersion curve will tend to be closer to the value at Gamma for most wave vectors, except at the vicinity of the zone surface. If chosen between 0.0 and 1.0, the dispersion curve will reach the longitudinal phonon mode only quite close to the Brillouin zone center.
Ensure electric charge neutrality - This actively ensures electric charge conservation law and may adjust the Born effective charge tensor accordingly.
For evaluating the Raman tensor from finite differences, the supercell can be specified in a custom manner (see Custom Supercells for the phonon calculations). Supercell to Obtain Raman Tensor: New Lattice Vectors provide nine entry fields for specifying the three components of each new lattice vector. This defines the supercell in terms of the lattice vectors of the original cell. Size information and the number of supercell calculations required for the Raman tensor are shown, and verification and display of supercells are provided, just like in the Supercell panel for the phonon supercells.
Displacement of atoms for Raman tensor calculation specifies the magnitude of atomic displacements in Angstrom to evaluate the response of the dielectric tensor needed for the Raman tensor. Displacements in both directions for all three Cartesian directions are evaluated without taking into account symmetry.
The following sections below describe in detail how to analyse phonon results after the Phonon run has finished.
2.14.3. Phonon Dispersion / Phonon Band Structure
Click on Analysis >> Phonon Dispersion or on Phonon >> Phonon Dispersion to open a dialog for selecting results from completed jobs. Selecting one or more jobs opens graphics windows showing the corresponding phonon dispersion plots. An additional Phonon Dispersion item appears in the MedeA Tool bar, when the active window displays Phonon dispersion results: It provides access to display style (lines or points), to measuring facilities, and to the display of exact (blue), high precision (green) and low precision (yellow vertical lines) k points along the path.

Moving the cursor over points of the dispersion curve provides information on coordinates of the k-point and frequency (THz and 1/cm). The selected phonon mode appears highlighted in green. Right click anywhere in the Phonon Dispersion window provides the usual Save as postscript, Export to text file, Export to CSV, Export to picture, Increase line width, Decrease line width and Unzoom facilities. If a phonon mode is highlighted an additional item Animate appears in the context menu, which provides access to the animation of the selected phonon mode. The supercell underlying the calculation is created in a structure window, and in the MedeA Toolbar the buttons for starting, stopping, recording and customizing an animation appears (see the section on analyzing trajectories for further details).

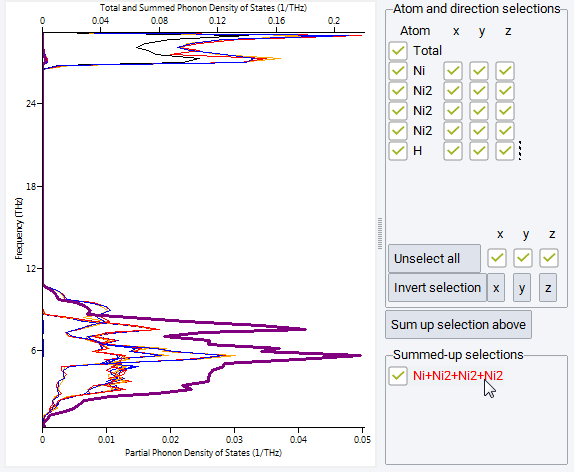
2.14.4. Phonon Density of States (Phonon DOS)
Click on Analysis >> Phonon Density of States or on Phonon >> Phonon Density of States to open a dialog for selecting results from completed jobs. Selecting one or more jobs opens new windows with the calculated phonon density of states (DOS). The plot provides the total phonon DOS as well as the partial phonon DOS for each atom of the original cell, and each Cartesian direction, as can be selected for display from the checkboxes of the Atom and direction selections subpanel. The current selections can be summed up by pushing the Sum up selection above button, which creates a new line item to be controlled by an additional checkbox in the Summed-up selections subpanel named accordingly, e.g. Ni+Ni2+NI2+Ni2 in the Figure. Hovering the mouse over a line or an atom label highlights the line as well as the corresponding atom (or sum-of-atoms) label in the legend area to the right.
2.14.5. Symmetry Analysis, Infrared and Raman Activity
Symmetry analysis of all modes at the Gamma point provides access to Infrared and Raman activity of these modes. The information is provided in the Job.out file.
Symmetry analysis of Gamma point phonon frequencies:
Crystal Point Group: O_h  (m3m)
Supercell Point Group: D_3d (-3m)
panelle of irreducible representations of point group:
---------------------
IR   1 9 5 13 17 21 25 33 29 37 41 45
---------------------
A1g  1 1 1 1 1 1 1 1 1 1 1 1  x^2+y^2, z^2
A2g    1 1 1 -1 -1 -1 1 1 1 -1 -1 -1
Eg   2 -1 -1 0 0 0 2 -1 -1 0 0 0  (x^2-y^2,xy), (xz,yz)
A1u    1 1 1 1 1 1 -1 -1 -1 -1 -1 -1
A2u(I)  1 1 1 -1 -1 -1 -1 -1 -1 1 1 1  z
Eu(I)   2 -1 -1 0 0 0 -2 1 1 0 0 0  (x,y)
---------------------
Note
Directions and components, like x, y, xz, … might be not oriented towards crystallographic axes because VASP uses the primitive unit cell in many cases
2.14.6. Thermodynamic Functions
The thermodynamic functions as a function of temperature are listed in the Job.out file. Internal energy, entropy, free energy, heat capacity , and zero point energy are available.
T    Cv    E(T)-E(0)   S(T)  -(A(T)-E(0))   E(T)    A(T)
K   J/K/mol   kJ/mol   J/K/mol   kJ/mol    kJ/mol   kJ/mol
--- ------ ------ ------ ------ ------ ------
0   0.0000   0.0000   0.0000   0.0000   12.9143   12.9143
...
5   0.0021   0.0000   0.0004   0.0000   12.9143   12.9143
...
200   23.5541   2.3790   19.6519   1.5513   15.2933   11.3630
225   25.6192   2.9939   22.5462   2.0790   15.9082   10.8353
250   27.5915   3.6592   25.3485   2.6779   16.5735   10.2364
273   29.3062   4.3137   27.8519   3.2898   17.2280   9.6245
275   29.4503   4.3725   28.0664   3.3457   17.2868   9.5686
298   31.0452   5.0684   30.4959   4.0193   17.9827   8.8950
300   31.1784   5.1306   30.7040   4.0805   18.0449   8.8338
...
3000   49.5523  132.5443  133.2876  267.3160  145.4586  -254.4017
The thermodynamic functions and their contributions from electronic and vibrational effects can be analyzed in a customized fashion within their graphical depictions. To this end click on Analysis >> Thermodynamic Functions or on Phonon >> Thermodynamic Functions to open a dialog for selecting results from completed jobs. Selecting one or more jobs opens new windows with the calculated temperature dependent thermodynamic functions, and a number of tools for customization. For more details see section 2.11.3 on MedeA Analysis of Thermodynamic Functions.

2.14.7. Infrared and Raman Spectra
The IR and Raman spectrum can be analyzed using Analysis >> Spectra >>:highlightgray:IR/Raman Spectra command. This brings up a list of previously calculated Infrared and Raman spectra, which may be calculated by VASP, MOPAC, or GAUSSIAN. After you select a spectrum, it is brought up in a new window in MedeA:

The model is in the left pane. You can adjust the size of the panes using the small square button near the bottom of the “sash”. In the right pane is the calculated spectrum, in red. You can import experimental data using the Import… button. At the bottom of the window are three sliders, Scale factor, Line width and Intensity scaling. These allow you to adjust the calculated spectrum to match the experiment. Scale factor uniformly scales the frequency.
Since frequencies are typically calculated for 0K and experiments are at higher temperatures, scaling the frequencies by 0.9 to 1.0 will improve the fit. Likewise the Line width slider is used to scale the width of the calculated lines. They are arbitrarily broadened with either a Gaussian or Lorentzian function, with a line width given by the slider. To change the broadening function used, click the More… button. The Intensity scaling slider adjusts the intensity of the calculated spectrum, typically in arbitrary units.
The legend at the middle left side of the graph is active. Clicking on the items will turn the display of the corresponding elements on and off. By default, a “stick” spectrum is not displayed, and the broadened line spectrum is. Finally, across the top of the graph are short blue lines that give all the fundamental frequencies, whether they are active or not. If you hover the mouse over one of the short lines, the frequency and intensity are displayed just below the graph. For spectra obtained from MOPAC or GAUSSIAN calculations an additional item Animate appears in the context menu (right-mouse click), which provides access to the animation of the selected mode. For spectra obtained from Phonon, animations of these modes are only available from the phonon dispersion plot by right-clicks on the corresponding mode at the Gamma point. Also see section 2.11.2 on MedeA Analysis of IR/Raman Spectra.
2.14.8. Export Phonon Dispersion and DOS
Sometimes it is very convenient to have the information from a calculated phonon dispersion or DOS calculation in numerical format or to highlight a specific mode for a publication.
First, select the results from a list of completed calculations.

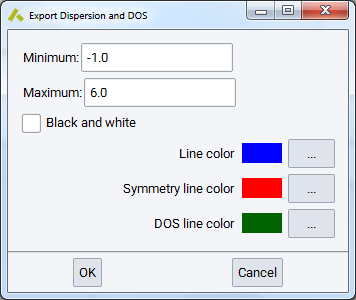
You can restrict the export to a narrower frequency range by setting a Minimum (THz) and Maximum (THz). This would allow for excluding some imaginary modes around the \({\Gamma}\) point. The selected range applies to all results chosen on the list.
The color choices apply only to Excel and specify:
- Line color for bands
- vertical Symmetry line color and the
- color for the DOS line plotted on the right side of the band structure graph.
You can export the DOS values as a text file (.txt) or if Excel is installed, also into a spreadsheet (.xls) which contains the band structure as well.
| [1] | K Parlinski, ZQ Li, and Yoshiyuki Kawazoe, “First-Principles Determination of the Soft Mode in Cubic ZrO 2,” Physical Review Letters 78, no. 21 (1997): 4063-4066. |
| download: | pdf |
|---|